Introduction
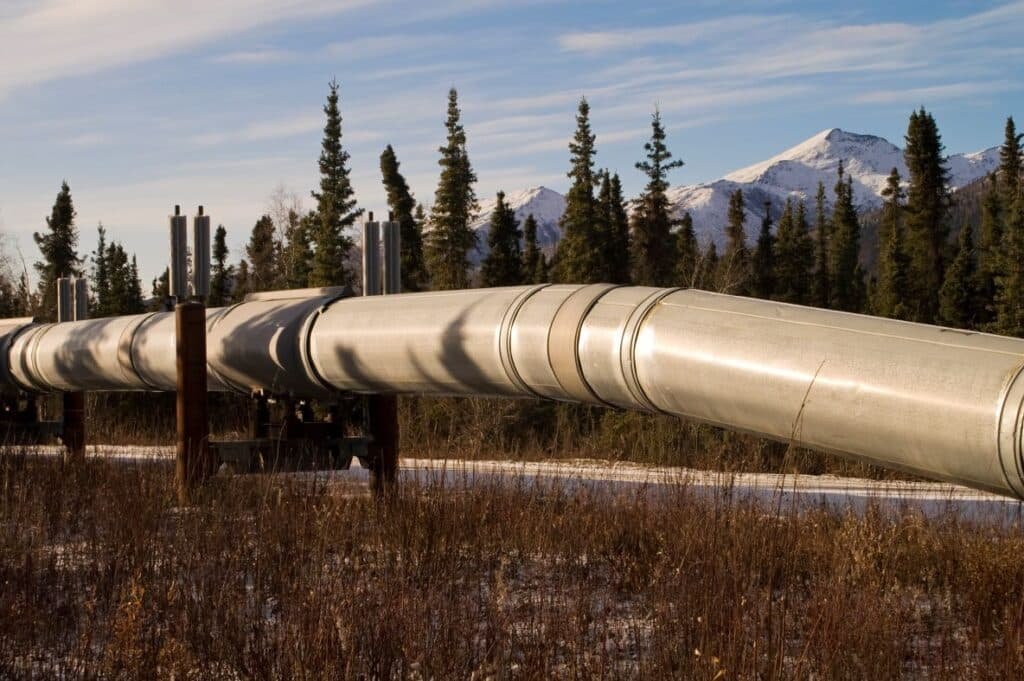
A major client in Asia operates a crude oil pipeline to transport oil from a Petroleum Derivatives Terminal to a Refinery. The total pipeline length is approximately 1,014 km, with intermediate pumping stations to enable faster oil transfer. The purpose of the field test was to demonstrate the effectiveness of the drag reducing agent (DRA) DORF™ SR1642 in improving transfer flow rate. Based on initial simulations, an improvement in the drag reduction factor (%DR) in the range of 25% to 35% was expected to increase the transfer flow (%TI) by approximately 15% to 19%. The formula applied to calculate the drag reduction factor is as follows:
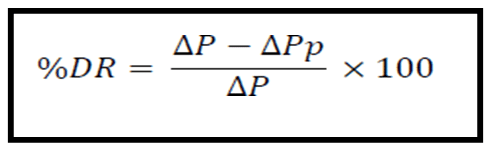
ΔP = Initial pressure drop without DRA
ΔPp = Pressure drop with DRA
%DR = % Drag Reduction obtained using the DRA
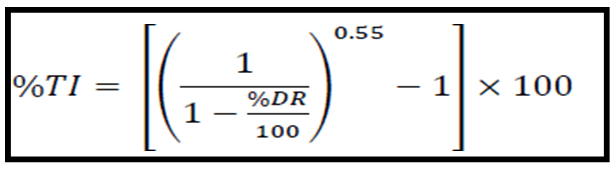
The %DR is used to calculate the increase in transfer rate (%TI) using the following formula:
Main Test Highlights
(1) A drag reduction improvement of 26% was observed from the moment DORF™ SR1642 was injected into the pipeline between Pump Station #4 (ST4) and the Refinery (REF).
(2) The flow rate increased by an average of 40 m³/h, from 1732 m³/h to 1772 m³/h, with a peak flow of 1795 m³/h.
(3) Pressures at Pump Station #4 (ST4) were reduced from 69 kg/cm² to 54 kg/cm² during the application of DORF™ SR1642.
(4) The drag reduction and flow improvement observed during the test period were limited by the discontinuation of DORF™ SR1642 injection. These do not represent the final or maximum potential values achievable with continuous product use. This is evident in the graphical representation of the “% Drag Reduction” and “Pressure Station #4” curves, which do not show a tendency toward stabilization but continued improvement during the injection phase.
Field Test Planning
The field test started on November 13 at 15:20 h at both locations (Station 4 and Station 5). The experimental dosage was set at 10 ppm for both sites. DRA injection was stopped at Station #5 (ST5) on November 16 at 11:30 h and resumed at 17:30 h on November 17. This was done to assess the effectiveness of DORF™ SR1642 injection from Station #4 (ST4) to the Refinery (REF) without injection at Station #5 (ST5).
The DRA injection test at Station #4 (ST4) ended on November 19 at 17:00 h and at Station #5 (ST5) on November 21 at 10:00 h. The typical transit time for crude oil from ST4 to ST5 is about 51 hours at a flow rate of 1700 m³/h to cover approximately 201 km in a 30″ pipeline, and the time for crude to flow from Station #5 (ST5) to the Refinery is about 56 hours at a rate of 1700 m³/h, covering 220 km in a 30″ pipeline. Overall, it typically takes about 107 hours or 4.5 days for crude oil to flow from Station #4 (ST4) to the Refinery.
Baseline Parameters for Evaluation
Flow rate: 1732 m³/h
The ΔP (kg/cm²) in each section at the start of the study was as follows:
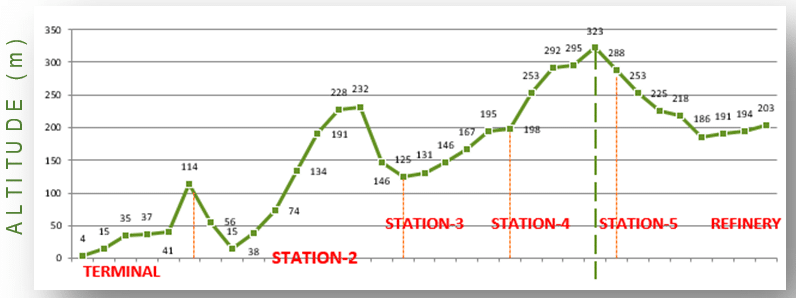
Based on the above baseline data, the following chart shows the altitude profile and locations of the respective Pumping Stations.
Performance
Chart 2 below illustrates the drag reduction achieved along the pipeline from Station #4 (ST4) to the Refinery and the corresponding increase in flow rate. Chemical injection began at Station #4 (ST4) approximately 50 hours before 15:20 h, allowing distribution of the DRA between Stations 4 and 5. The test ended on November 19 at 17:00 h, when chemical injection at Station 4 (ST4) was stopped. The transient-phase drag reduction achieved using DORF™ SR1642 was calculated at 26%.
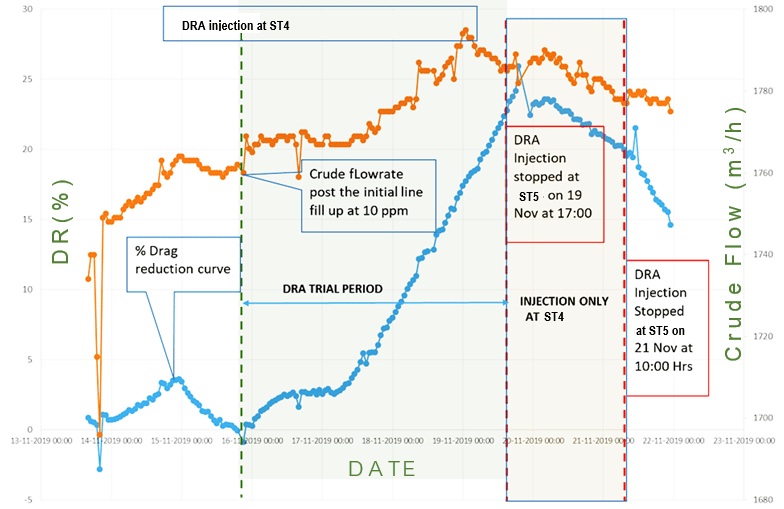
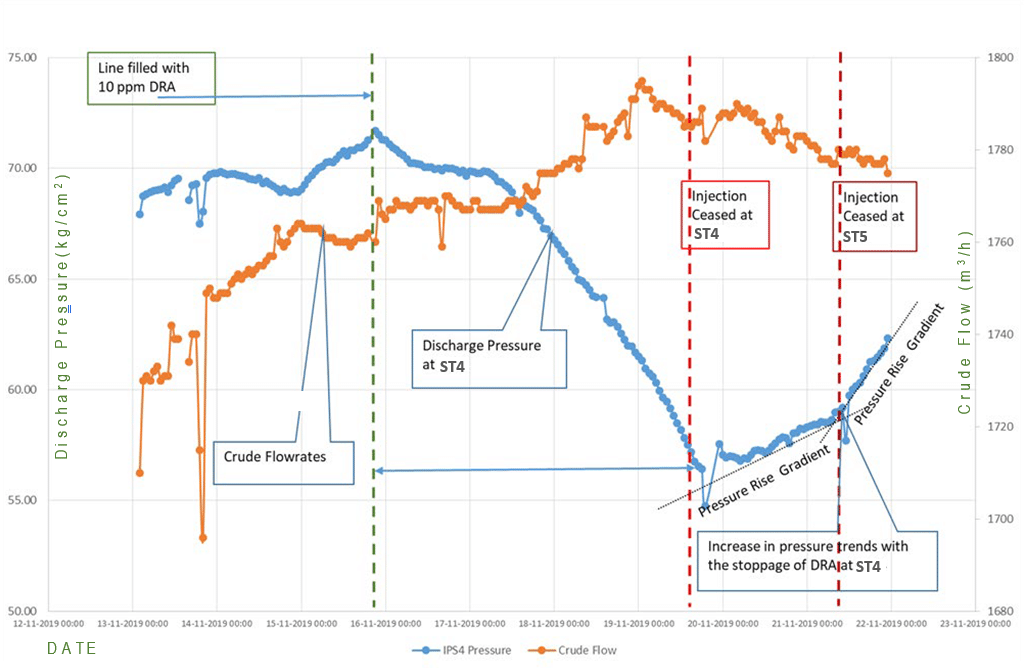
Chart 3 shows the discharge pressure at Station #4 (ST4) compared with crude oil flow, with and without DRA. The discharge pressure decreased by approximately 21% (from 69 kg/cm² to 54 kg/cm²). Pressure began to rise immediately after DRA injection was stopped. The increase in pressure gradient following injection stoppage at Station #4 (ST4) and subsequently at Station #5 (ST5) is also clearly visible in the chart — the pressure rise was very rapid when injection was halted at both sites. The change in ΔP indicates that the drag reducing agent helped lower backpressure throughout the line, allowing pumping at a higher flow rate.
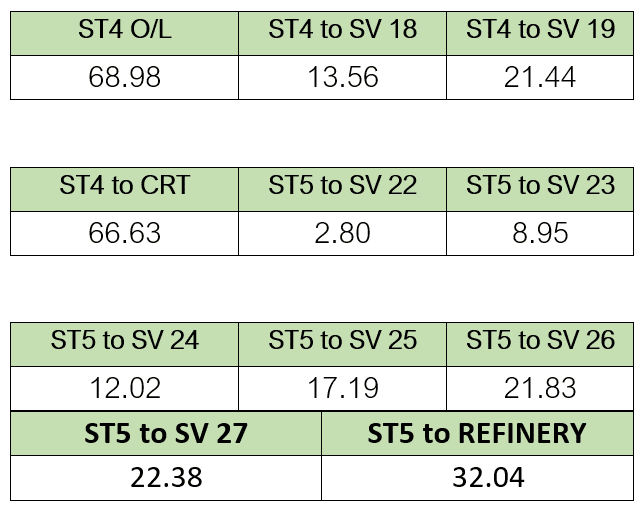
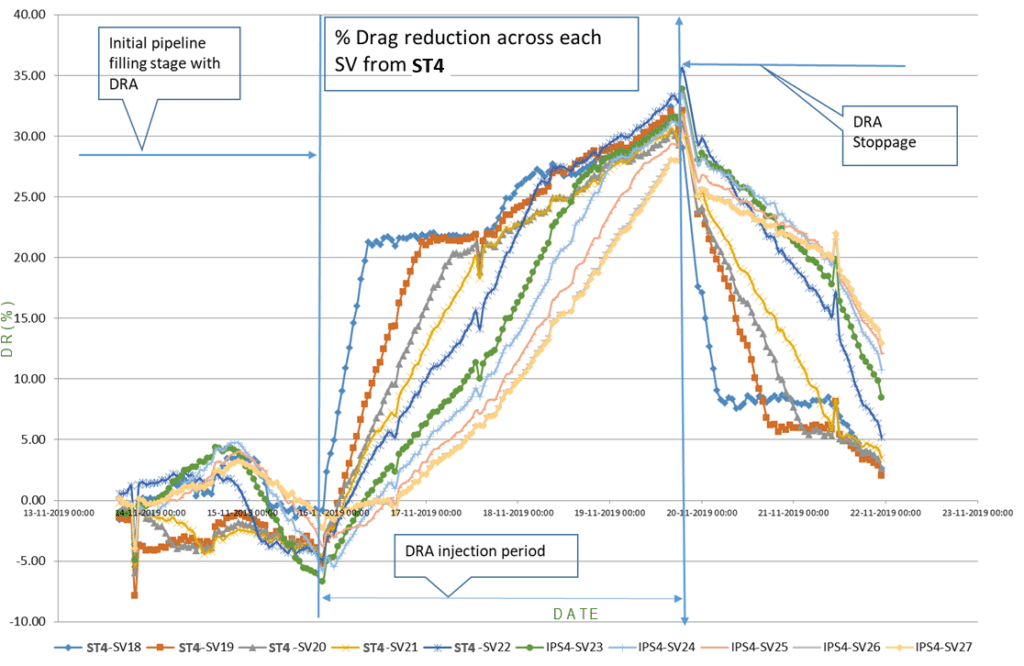
However, since the test was limited to the section between Station #4 and the Refinery, and not the entire pipeline, the flow increase does not correspond proportionally to the % Drag Reduction. Chart 4 shows the % Drag Reduction across each sectional valve (SV#) after the initial line filling period from Station #4 until the chemical was depleted. At the point of chemical depletion, the drag reduction observed was in the range of 28% to 35%. This represents a transient phase and not the final achievable drag reduction, as evidenced by the upward trend.
Maximum drag reduction is reached asymptotically and can only be fully evaluated after continuous product use. Data from each sectional valve and corresponding drag reduction were analyzed, confirming the effectiveness of the DRA applied during the limited experimental period.
Conclusions
Based on the field trials, the following conclusions can be drawn:
The DORF™ SR1642 product demonstrated 26% performance at a dosage of 10 ppm during the six-day test period. This represents a transient phase, not the final achievable drag reduction. Maximum drag reduction is reached asymptotically and can only be evaluated after continuous product use.
The DORF™ SR1642 product also contributed to a discharge pressure reduction at Station #4 of approximately 21%, which also implies lower backpressure throughout the pipeline. Again, this does not represent the final potential value but corresponds to the point of chemical depletion.
The discharge pressure reduction directly translates to lower energy consumption by the Station #4 (ST4) pumps based on their characteristic curves.
Further tests may be conducted by extending operational time or adjusting injection parameters.